Excel for Project Management
Excel as Your Project Management Workhorse
While dedicated tools like Jira and Asana dominate the enterprise market, Excel remains the most flexible and accessible tool for managing projects of all sizes. No licenses, no training, no IT approval — just Excel and a clear structure. For freelancers, small teams, and anyone whose project management needs outgrow sticky notes but not spreadsheets, Excel is often exactly the right answer.
The key is knowing which Excel features map to which project management needs: timelines become Gantt charts, task lists become sortable tables, resource allocation becomes Pivot Tables, and status tracking becomes Conditional Formatting.
Step-by-Step: Build a Project Tracker with Gantt Chart
Scenario: You're managing a 3-month software development project with 25 tasks. Build a tracker that shows status, timeline, and who's overloaded.
Step 1 — Build the task table
- Create headers (row 1): Task ID, Task Name, Owner, Start Date, End Date, Duration, Status, Priority, %Complete, Notes.
- Select headers and first empty row. Press Ctrl+T to create an Excel Table. Name it "Tasks" (Table Design tab).
- Duration formula in F2:
=E2-D2+1(end minus start, plus one to include both days). - Add Data Validation dropdowns: Select Status column > Data > Data Validation > List, source:
Not Started,In Progress,Completed,Blocked. Do the same for Priority:High,Medium,Low. - Enter your 25 tasks. Use consistent Owner initials (e.g., JD, AS, MK) for reliable filtering later.
Step 2 — Add automated status formulas
- Overdue check (column J):
=IF(AND(E2 - Days remaining (column K):
=MAX(0, E2-TODAY()) - These automations mean you don't need to manually scan for late tasks — Excel tells you instantly.
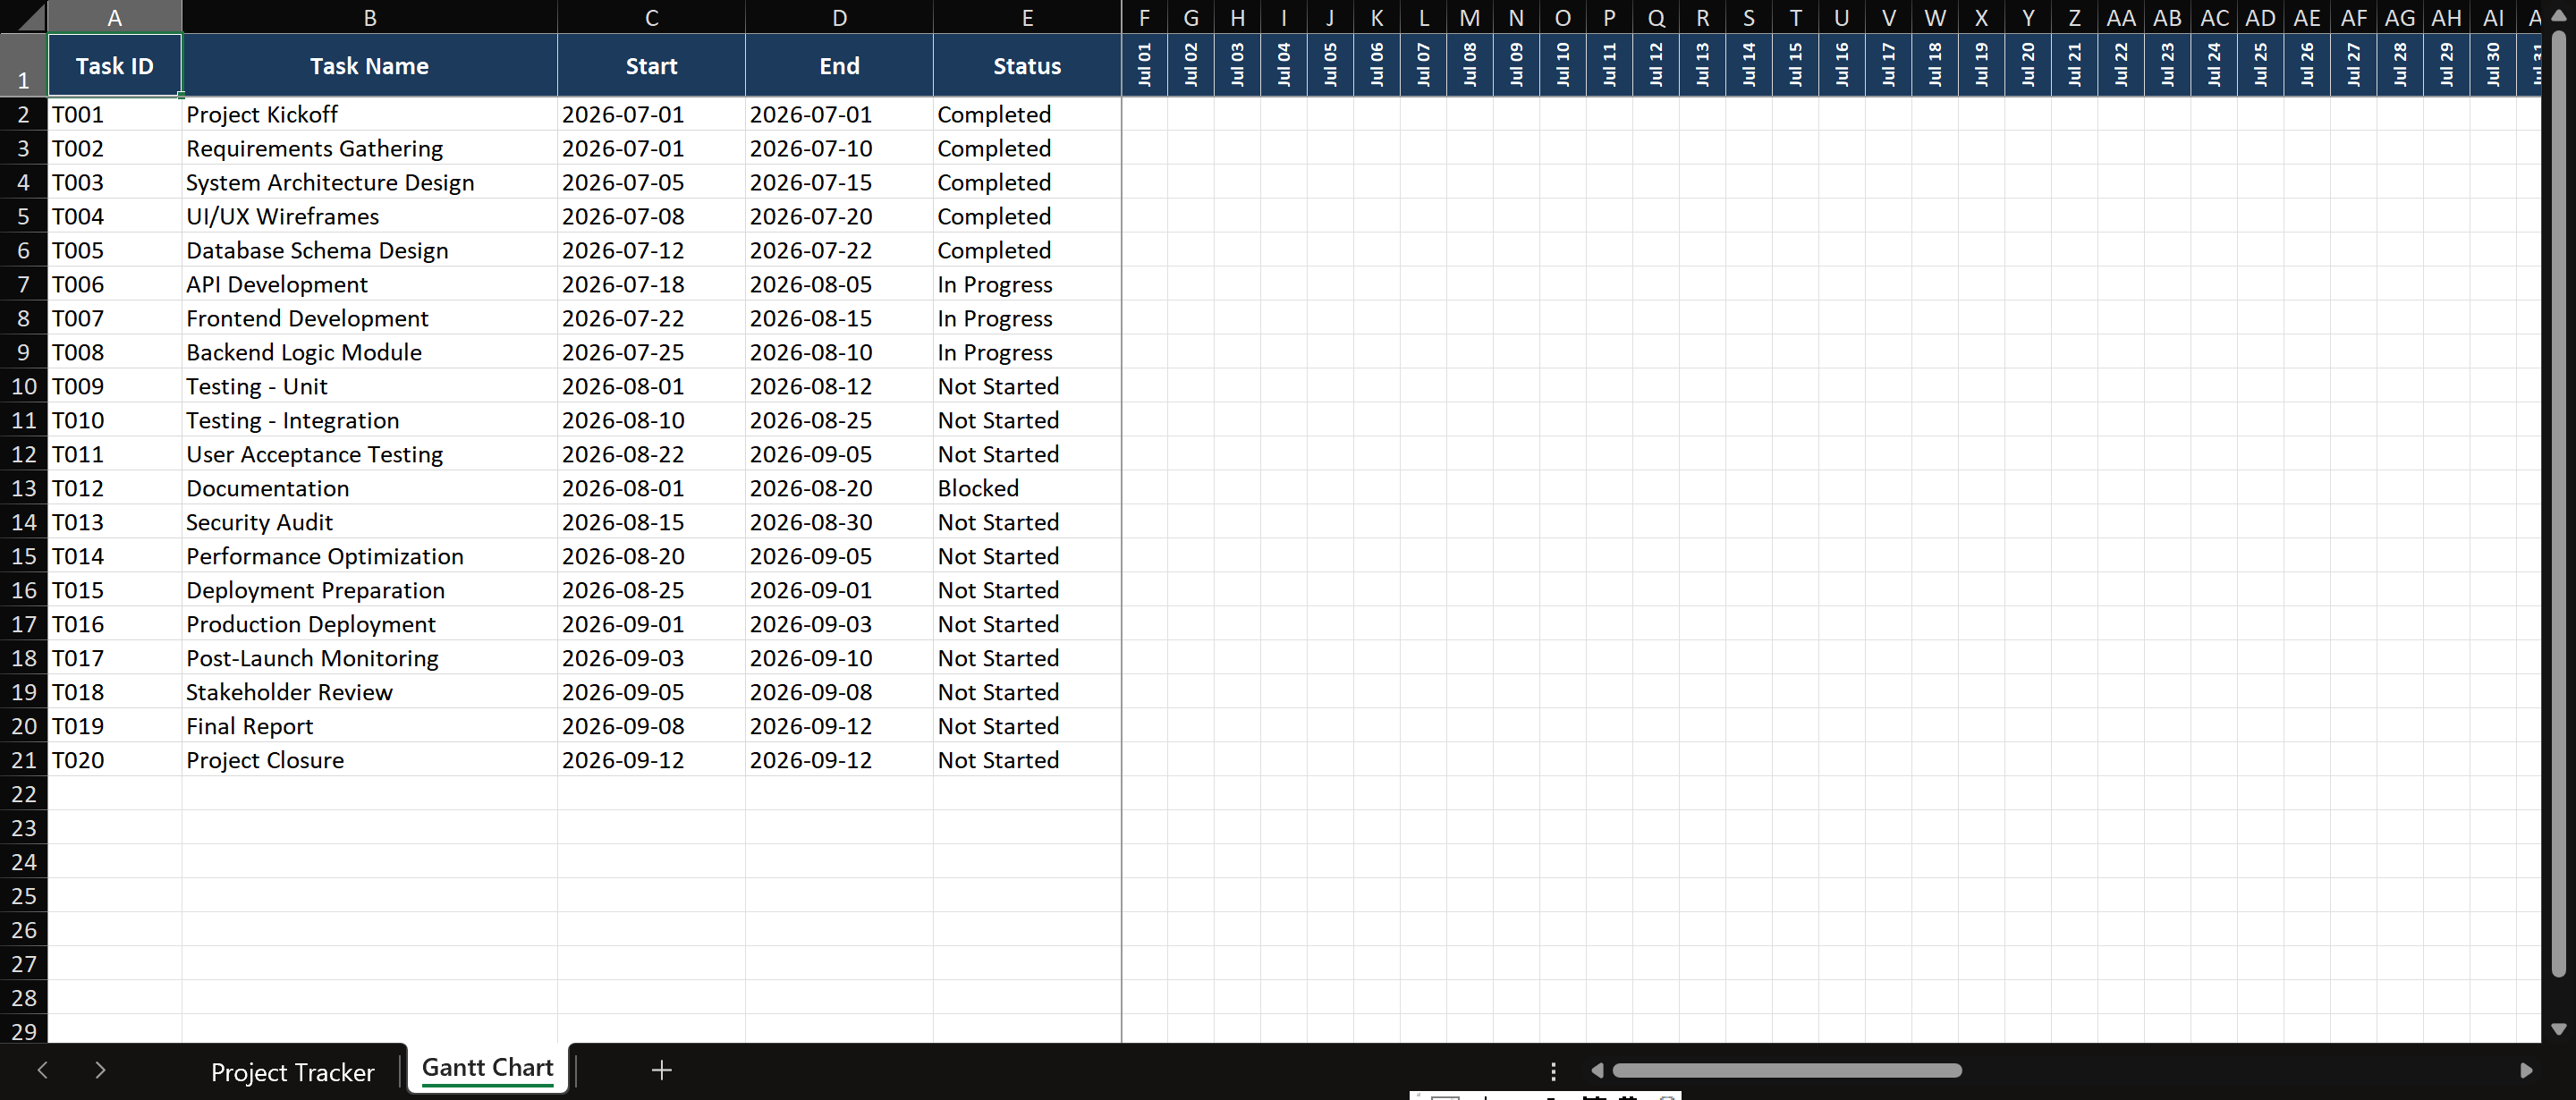
Step 3 — Build the Gantt chart with Conditional Formatting
- Starting at M1, enter dates across columns: 7/1, 7/2, 7/3 … through 9/30. Use
=SEQUENCE(1, 92, DATE(2026,7,1))in Excel 365, or type the first two and drag-fill the rest. - Format date headers: rotate text (Ctrl+1 > Alignment > 90°), set column width to 3.
- Select the entire Gantt grid area (M2:CV26). Home > Conditional Formatting > New Rule > Use a formula.
- Formula:
=AND(M$1>=$D2, M$1<=$E2). This checks: is the date in row 1 within the task's start-end range? - Click Format > Fill, choose a blue color. Click OK.
- Add a second rule for overdue tasks:
=AND(M$1>=$D2, M$1<=$E2, $G2="Overdue")with red fill. - Add a third rule for completed tasks:
=AND(M$1>=$D2, M$1<=$E2, $G2="Completed")with green fill.
Step 4 — Create the project summary
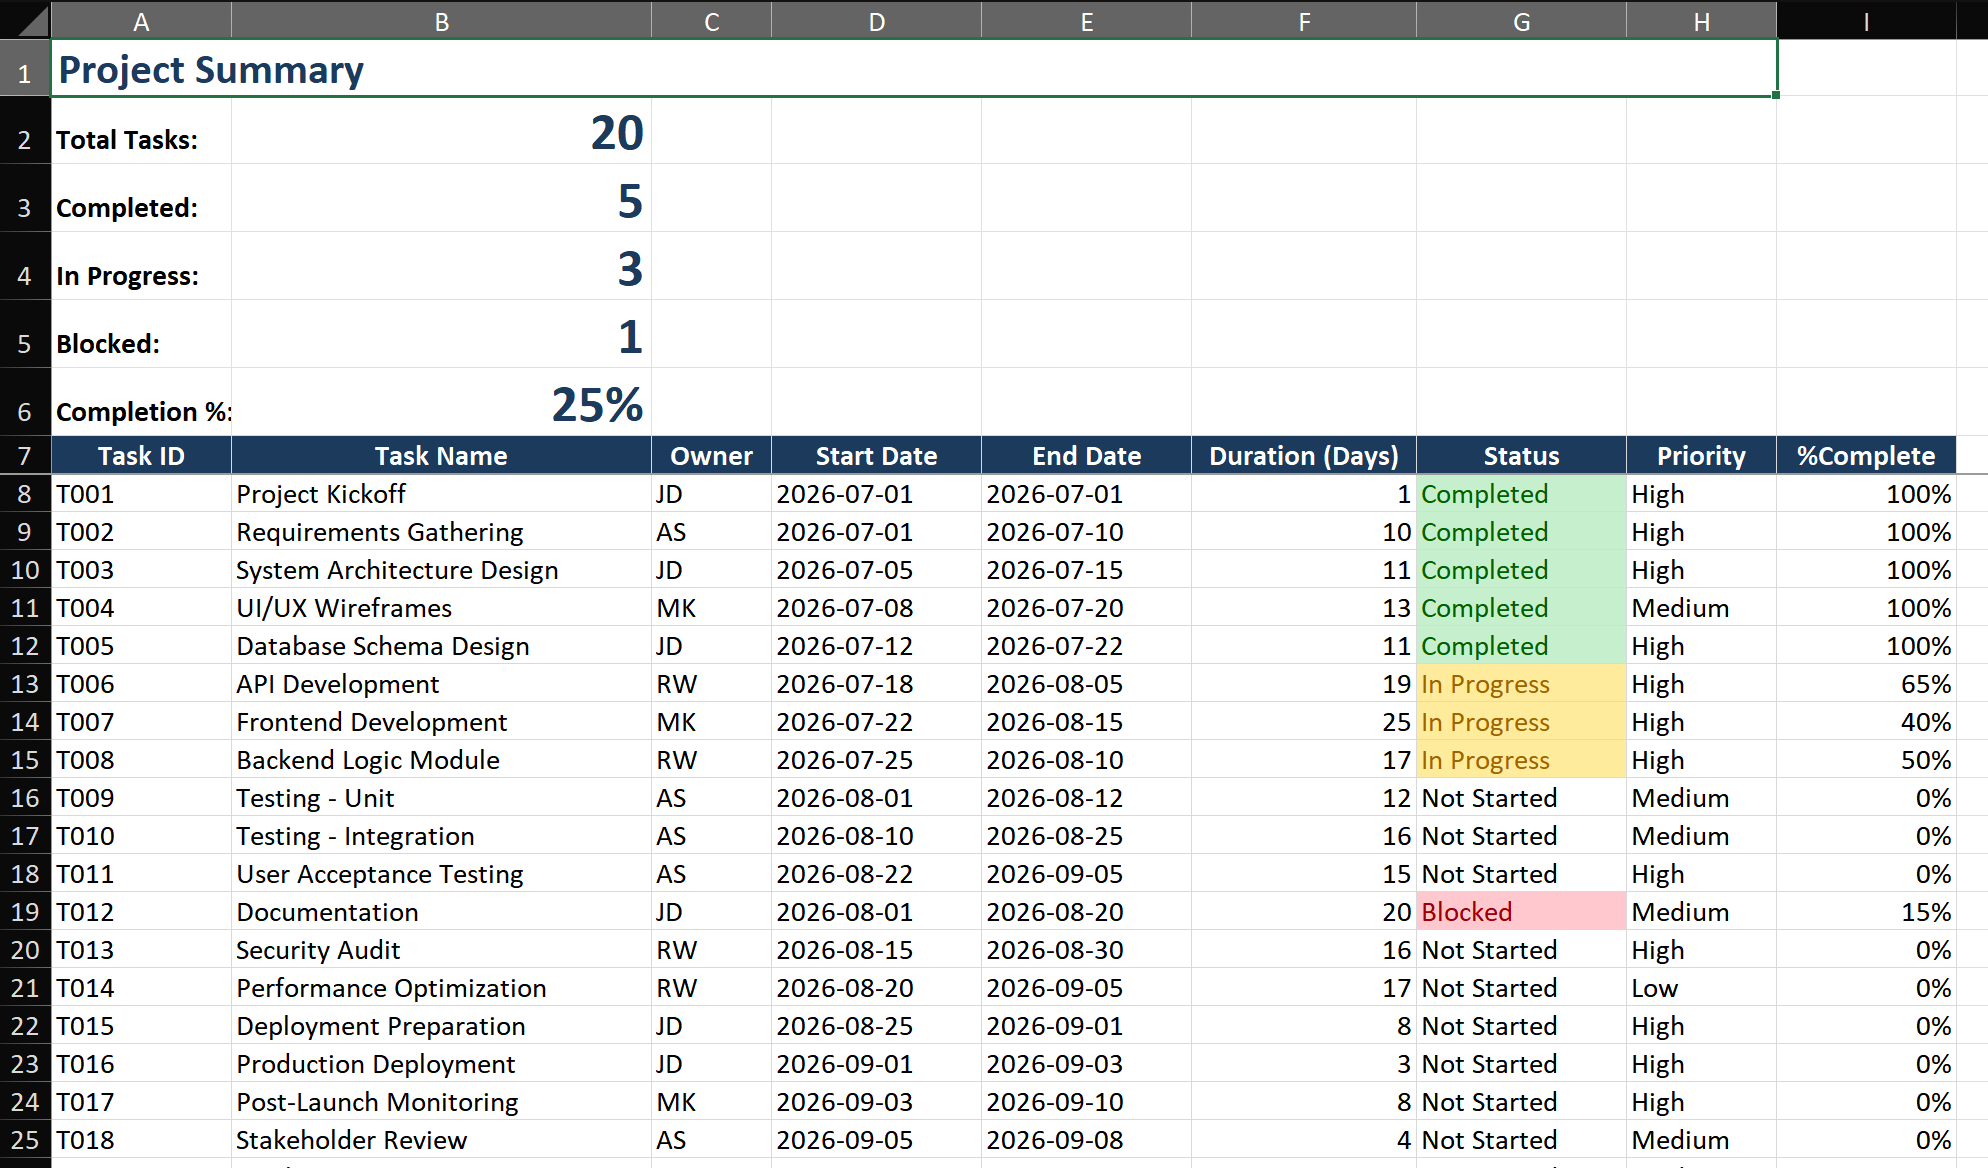
- Above the task table, create a summary section with these formulas:
- Total tasks:
=COUNTA(Tasks[Task Name]) - Completed:
=COUNTIF(Tasks[Status], "Completed") - Completion %:
=Completed / Total - Overdue:
=COUNTIF(Tasks[Overdue], "⚠ Overdue*") - Format the summary as large KPI boxes for at-a-glance status review.
Key Techniques
Technique 1 — Resource allocation with a Pivot Table
- Select the Tasks table, Insert > Pivot Table > New Sheet.
- Drag Owner to Rows, Duration (Sum) to Values. This shows each person's total assigned workdays.
- Add a calculated field: PivotTable Analyze > Fields, Items & Sets > Calculated Field. Name: "Workload%", Formula:
=Duration / 60(assuming 60 working days in the project). - Now you can instantly see who's over 80% capacity and needs tasks reassigned.
Technique 2 — Dependency tracking
- Add a "Predecessor" column with Task IDs that must finish before this task starts.
- Add a dependency check formula:
=IF(SUMPRODUCT((Tasks[Task ID]=C2)*(Tasks[Status]<>"Completed"))>0, "Blocked", "Ready") - Use Conditional Formatting to highlight blocked tasks in orange — they're at risk of delaying the project.
Common Mistakes
- Over-engineering before data exists. Building a 20-column tracker with complex formulas before you've ever managed a project in Excel leads to abandonment. Start minimal, add complexity as you learn real needs.
- Using regular ranges instead of Tables. Without Excel Tables, formulas don't auto-expand, and Pivot Tables need manual range updates when you add tasks. Always Ctrl+T.
- Ignoring non-working days. Duration formulas that don't account for weekends produce unrealistic timelines. Use
=NETWORKDAYS(Start, End, Holidays)for business-day calculations. - Not backing up before major operations. Sorting a formula-heavy table can scramble references. Save a timestamped copy before any sort or restructure.
Advanced Tips
- Critical path calculation: Build forward-pass (earliest start/finish) and backward-pass (latest start/finish) formulas. Tasks where earliest start equals latest start are on the critical path — highlight them to show which delays impact the finish date.
- Power Query for multi-project rollup: If managing multiple project files, use Power Query to combine all task tables into one master view. Filter across entire portfolios by project, owner, or status.
- Earned Value Management (EVM): Add Planned Value (PV), Earned Value (EV), and Actual Cost (AC) columns. Calculate SPI (=EV/PV) and CPI (=EV/AC) for industry-standard progress and cost performance tracking.